Introduction
Background: Aristotle believed and convinced mny people that ll objects made of earth fall toward the earth at constant velocity. Additionally, he thought that the heavier an object was the faster the object fell. Galileo attempted to disprove his theory while not offending the leading members of the church. He also wanted to prove this because his idea of heliocentricity was not welcomed at all against the significantly more powerfull Catholic Church who cupported the ideas of geocentricity. Galileo wanted to prove that the when an object is dropped from any height (is in freefall), that the velocity of the object as it falls to the ground is not constant as Aristotle says, but that it increases. For example, Aristotle would think that if a bowling ball and a tennis ball were dropped that the bowling ball would hit the ground first due to the fact that it weighed more; however, Galileo thought that they would fall at the exact same rate and hit the ground at the exact same time.
Observations: This lab works by the tester holding and dropping the ball in front of the meter stick so as to be able to tell how fast the ball is falling and at what speed the ball is falling at specific points in time. The device we are using to accomplish these tasks is a camera that takes thirty pictures/ second which will allow us to know how fast the ball is moving and what point in time the recorded speed was.
Quantities: The measureable quantities in this experiment are the speed of the object in cm/s which can be converted to m/s. These quantities will be measured at different times in order to determine whether or not the object is falling at a constant velocity.
Hypothesis: As time increases, speed increases because gravity is always pulling it down.
Methods
The variable we are testing for while conducting this experiment is the speed of the object as it falls to the ground. The variables that remain the same throughout the experiment is the height from which the ball is dropped and the object that is being dropped. Additionally the meter stick was always in the exact same spot because we taped the meter stick the wall. The video was also made accurate because the camera was held steady while it took thirty frames per second. To conduct the test we began by holding the ball above the meter stick; therefore, it started from rest. We dropped the ball while being able to see the entire path of the ball travel through one meter. Next, we took our camera that was shooting 30 frames per second graphed the motion of the object from rest to the moment it hit the ground. In order to graph these points, we imported our video to logger pro where we were able to select specific points where the ball was in mid-air. By graphing the points of the path of the ball, we were able to determine that ball was accelerating. The physical equation of the falling ball that we were able to determine from our graph was x=6.51t^2-24.97t+23.69. This equation was determined through the use of graphical analysis and fitting a line curved line to our data points. Our percent error was calulated by doing the absolute value of 6.511-9.8 then dividing the difference by 9.8. the percent error was 33.6%.
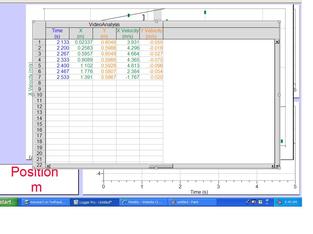
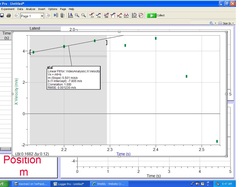
Graph and Data Table of Our Falling Ball
Graph and Data Table of Our Falling Ball
Results
The meaning of the equation that we determined from our graph is that the ball is accelerating as it falls through the air. Our hypothesis, which was Galielo's hypothesis, was correct that if a ball is dropped the speed will increase simultaneously (and not remain constant as Aristotle predicted) because gravity is pulling t to the ground. Although we were correct, further invesitgations should most likely be conducted because our percent error was too high to consider our data and graphs as 100% believable. In order to ensure more accurate data there are a few things that I would do. One improvement that could be made is to use a camera with a faster shutter speed. The camera that we used was shooting 30 frames per second; a faster camera would provide a more clear picture. Another adjustment we could make is that when the frame is paused in our video representing the balls movement through one thirtieth of a second, we should plot our point on the bottom of the blur representing the ball. We plotted our point in the middle of the ball which is not correct. I think that our came from plotting the points slightly off on the blurred ball than where they should have been. Another source of error is that we had to attempt to do our best with the the 30 fps cameras and therefore did not get the clearest data when attempting to plot our data points in logger pro. By making these changes we could be able to decrease our 33.6 percent error to a number that would further support our hypothesis, but overall, we were still able to prove our hypothesis correct by condcuting this experiment that was similar to Galileo's.
